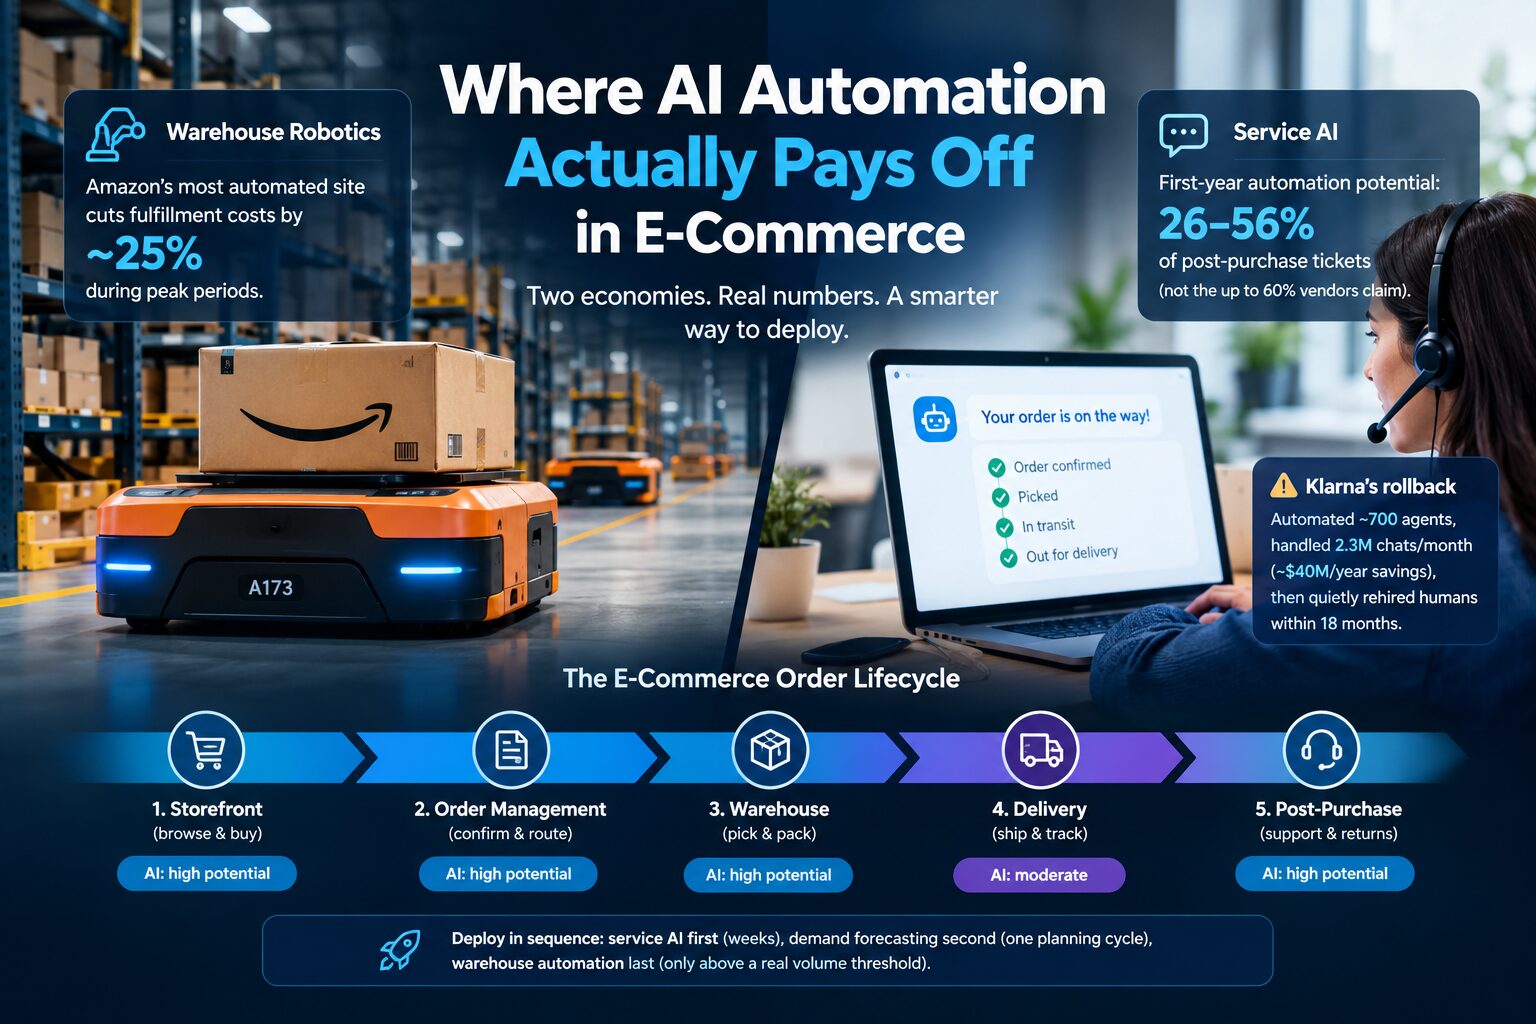
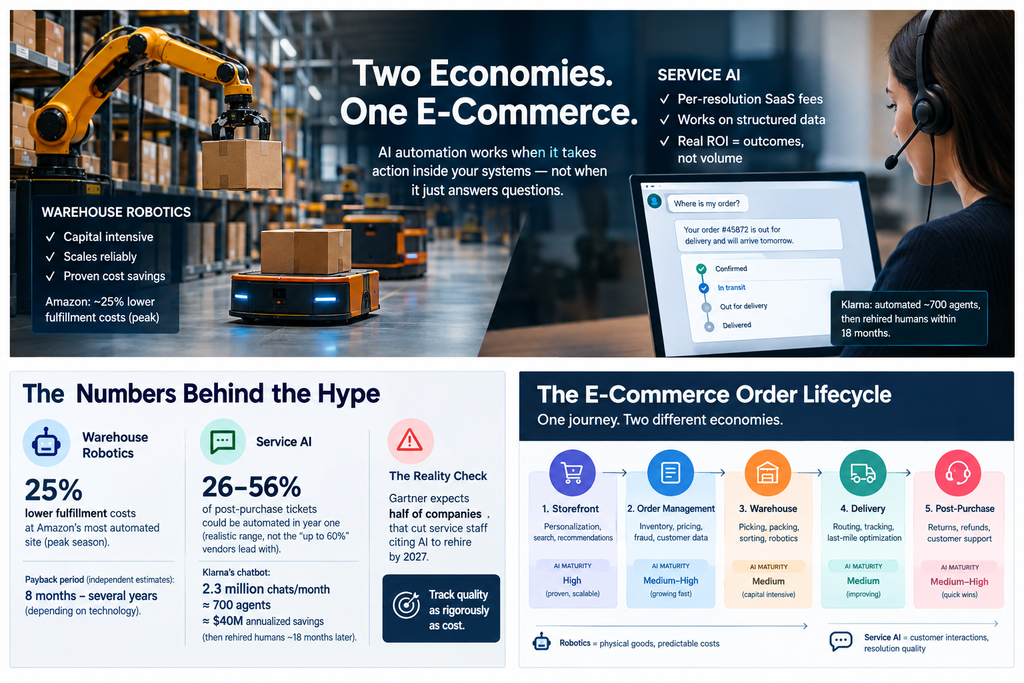
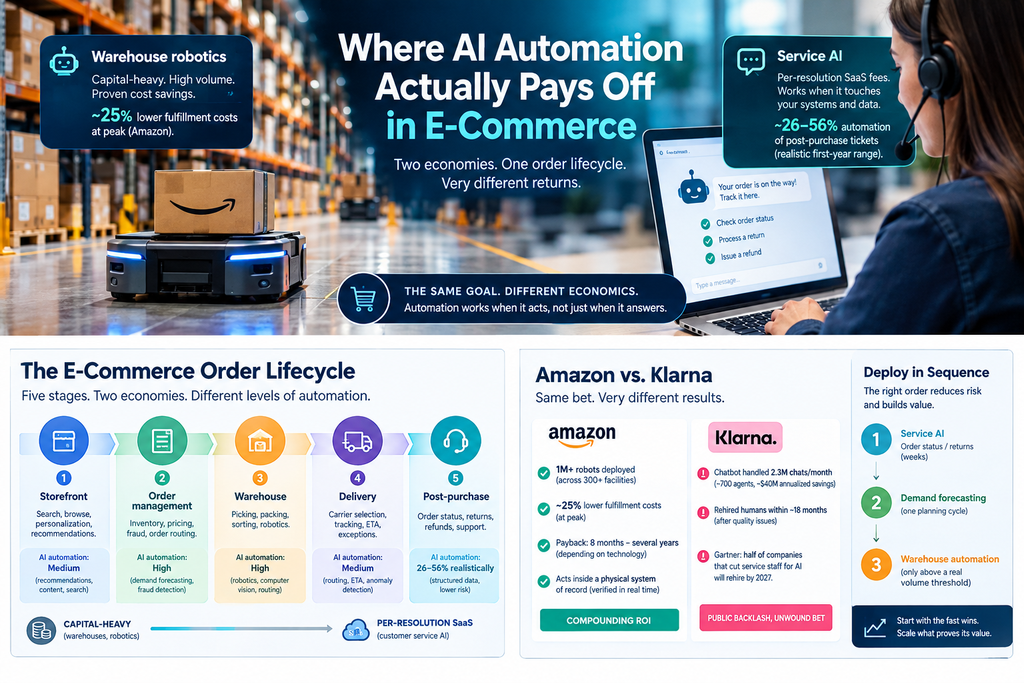
AI automation pays off in e-commerce when it takes actions inside your systems — checking a live order, issuing a refund, rerouting a pick — not when it merely answers questions. Warehouse robotics with a clear cost model scales reliably: Amazon’s most automated site cuts fulfillment costs by roughly 25% during peak periods. Conversational AI delivers its promised ROI only when wired directly into order data and measured on outcomes, not volume — and fails publicly when it isn’t, as Klarna discovered after automating the workload of roughly 700 agents and then quietly rebuilding its human team 18 months later.
TL;DR
- The order lifecycle is being automated from both ends on completely different economics: capital-heavy robotics in the warehouse, per-resolution SaaS fees in customer service.
- Post-purchase tickets (order status, returns, cancellations) are the wedge for service AI because the data is structured and the stakes of a wrong answer are low — but realistic first-year automation sits around 26–56% of that pool, not the “up to 60%” ceiling vendors lead with, and even that saving shrinks once you measure it against total support spend rather than just the automatable ticket pool.
- Klarna’s chatbot handled 2.3 million chats in a month — work it equated to roughly 700 agents and about $40 million in annualized savings — then began quietly rehiring humans within about 18 months. Gartner now expects half of companies that cut service staff citing AI to rehire by 2027.
- Fulfillment-side gains are better documented but slower to build: Amazon’s most automated site posts a 25% peak-season cost reduction; independent estimates put warehouse robotics paybacks anywhere from 8 months to several years depending on the technology.
- Deploy in sequence: service AI on order-status/returns first (weeks), demand forecasting second (one planning cycle), warehouse automation last (only above a real volume threshold).
Two Numbers That Explain the Whole Market
In mid-2025, two data points about AI in e-commerce operations landed within weeks of each other, and almost nobody connected them.
The first: Amazon passed one million robots deployed across its fulfillment network, a milestone that started with the robotic shelf-movers it inherited from its 2012 Kiva Systems acquisition and now spans robotic arms, autonomous mobile robots, and AI-driven routing across more than 300 facilities. The second: Klarna — the buy-now-pay-later firm that had become the poster child for AI customer service — began rehiring human support staff after its chatbot’s cost-driven scale-up produced service quality issues customers noticed before leadership did.
Both companies bet big on automation. One bet is compounding; the other got unwound in public, months before an IPO. The difference wasn’t ambition, model quality, or budget — it’s that Amazon’s robots act inside a physical system of record that gets checked constantly, while Klarna scaled a customer-facing system on cost and volume metrics without tracking resolution quality with the same rigor. Klarna’s own CEO put it plainly to Forbes: the company had “focused too much on efficiency and cost… the result was lower quality, and that’s not sustainable.”
That gap — a rigorous cost ledger sitting next to an unmeasured quality ledger — is worth naming, because it’s the single best predictor of which AI deployments in this article succeed and which ones become the next cautionary case study.
The Twin-Ledger Test
Before scaling any AI system that touches customers or orders, ask one question: are you tracking a quality ledger with the same rigor as your cost ledger? Not “do you have a CSAT number somewhere,” but: is a wrong or low-quality resolution surfaced and corrected as fast as a cost overrun would be?
This is a planning heuristic, not a reported industry metric. It reframes the Amazon/Klarna contrast into an operating principle: Amazon’s robotic picks are verified against inventory records in real time; Klarna’s chat resolutions were counted, not graded, until the gap showed up in churn. Apply the test to any tool in this article before you scale it past a pilot.
The Automation Map: One Lifecycle, Two Economies
Every e-commerce order passes through five stages — storefront, order management, warehouse, delivery, post-purchase — and automation maturity differs sharply across them.
Diagram: editorial synthesis of the deployment patterns documented below. The maturity bar is a qualitative estimate, not a cited statistic. Production note: this is inline SVG — most WordPress editors need a Custom HTML block to render it (not the default block editor’s image tool), and at typical mobile widths the smallest labels will still be tight to read. A static PNG/WebP export as a fallback for the block editor and for social sharing is worth generating alongside this file.
The physical side runs on capital: you buy or lease robots, and the investment amortizes against labor and error costs over years. The conversational side runs on usage: you pay per resolved ticket, and the unit economics live or die on how much of your volume is genuinely repetitive. Most buying guides collapse these into one category, “AI automation tools.” They aren’t one category, and treating them as one is why so many ROI spreadsheets die around month four.
The Post-Purchase Wedge: Why Service AI Starts at “Where’s My Order?”
Strip a typical e-commerce support queue to its raw material, and the same three questions dominate volume in most verticals: Where is my order?, How do I return or exchange this?, and Can I change or cancel my order? These are conversational in form but structured in substance — every one is answerable by reading and writing a handful of database fields: order status, carrier event, return eligibility window, refund method.
That’s the profile modern agentic AI handles well. Mechanically: a language model interprets the message, retrieves the relevant policy, then executes tool calls against the commerce platform — querying the order system, initiating a return, issuing a refund — instead of composing a reply that links to a help article. The difference between those two behaviors is the entire commercial argument. A chatbot that answers questions deflects tickets and manufactures repeat contacts. An agent that takes action resolves them.
The strongest evidence for where this pays off comes straight from Gartner’s own cost-per-contact benchmarking: the median cost per contact is $1.84 for self-service versus $13.50 for assisted channels — a roughly 7x gap that funds the entire business case, if the interaction is genuinely resolved rather than merely answered.
The strongest evidence for where it breaks is Klarna, and the mechanism matters more than the headline. The chatbot handled 2.3 million chats in its first month, work Klarna equated to roughly 700 full-time agents and about $40 million in annualized savings — the AI worked exactly as designed. The failure was sequencing: the company scaled a customer-facing system on cost and volume before it measured resolution quality with equal rigor, and found the gap only after customers had already felt it. By mid-2025, Klarna’s communications team confirmed it was “again recruiting humans for customer service” under a hybrid model — the AI still handles roughly two-thirds of inquiries, but with a guaranteed human path for anything that needs one. Notably, Klarna’s own reporting shows response times improved 82%, and repeat issues dropped 25% under the corrected hybrid model — the AI wasn’t the problem; unmeasured full-replacement was.
This is now a market-wide pattern, not one company’s stumble. Gartner’s own February 2026 forecast projects that half of the companies that attributed headcount cuts to AI will rehire staff into similar roles by 2027 — and, notably, the same research found only 20% of service leaders had actually cut agent headcount citing AI in the first place, versus a much louder public narrative. Gartner analyst Emily Potosky’s assessment doubles as the header for this entire section: “AI simply isn’t mature enough to fully replace the expertise, empathy, and judgment that human agents provide.”
The configuration Klarna settled on is the pattern this article recommends throughout: triage. AI absorbs routine volume; humans keep disputes, fraud, hardship cases, and anything emotionally loaded — the tickets where a wrong or tone-deaf automated answer does damage no savings figure offsets.
The Real Economics of the AI Service Agent
Vendor pricing pages advertise outcomes; the invoice tells the truth. Take Gorgias — the default helpdesk for a large share of Shopify brands — as the worked example, because its pricing model is representative of where the category is heading.
The AI Agent bills per resolved conversation: about $0.90 per resolution on annual plans, $1.00 on monthly billing, with overages running roughly $1.50 per interaction above your plan’s included allowance. Two mechanics catch buyers off guard. First, a fully AI-resolved ticket can be billed as both a helpdesk ticket and a resolution — the “double billing” complaint that dominates community threads — though per Gorgias’s own FAQ, the automation charge is waived if the customer reaches a human within 72 hours. Second, that same 72-hour window means automated interactions only finalize in reporting after the fact, which builds a lag into every optimization loop.
On performance, the gap between marketing and reality is the single most important planning number in this category. Gorgias markets “up to 60%” resolution, but its own published customer stories — individually citing outcomes like 56%, 30%, and 26% for different brands — land in that range rather than at the ceiling; that range has been compiled and cross-checked by independent trackers, including myAskAI — worth flagging as a competing AI-support vendor, so read its framing with that in mind. A cleaner, non-vendor data point points the same direction: G2’s independently collected performance benchmarks put the AI Agent’s response accuracy at roughly 59%, against a 71% category average. Treat 60% as a ceiling for well-tuned, high-repetition stores — never as a baseline for budgeting.
What the numbers look like for a mid-size store (editorial calculation, assumptions stated — not a vendor or research figure):
| Parameter | Value | Basis |
|---|---|---|
| Total monthly support tickets | 3,000 | Assumed |
| Repetitive share (order status/returns/cancel) | 45% = 1,350 tickets | Typical e-commerce mix, upper-middle of reported ranges |
| Non-repetitive tickets (always human, both scenarios) | 1,650 tickets | Remainder |
| Realistic AI resolution, year one (of the repetitive pool) | 35% ≈ 473 tickets | Midpoint of the documented ~26–56% range |
| Blended human cost per ticket | $6.00 | SMB offshore/remote blend; substitute your own |
| AI resolution fees | 473 × $0.90 ≈ $426/mo | Gorgias published per-resolution pricing |
| Residual ticket fees on AI-closed tickets | 473 × ~$1.75 ≈ $828/mo | Mid-tier helpdesk ticket fee; varies by plan |
| Remaining human-handled repetitive tickets | 877 × $6.00 = $5,262/mo | — |
| Non-repetitive tickets, unchanged cost | 1,650 × $6.00 = $9,900/mo | Never a candidate for automation |
| All-human baseline — full 3,000-ticket queue | $18,000/mo | — |
| Total cost after automation | ≈ $16,416/mo | Sum of the four automated-scenario rows above |
Two savings percentages fall out of this model, and only one belongs in a budget memo. Measured against the $8,100 cost of the repetitive pool alone, automation saves about 20%. Measured against the store’s full $18,000 monthly support spend, it saves about 9% — because the other 1,650 tickets a month (order changes, product questions, complaints, anything ambiguous) were never automation candidates and cost the same under both scenarios. Vendor pitches and quick mental math tend to quote the first number; a CFO reviewing the P&L will only recognize the second. Push the resolution assumption to the top of the documented range (56%) and the pool-level saving roughly doubles, but the total-spend saving still lands in the low-to-mid teens — plan around that number, not the vendor ceiling.
Fulfillment: Where the Gains Are Slower, Bigger, and Better Documented
If the service layer automates on software margins, the warehouse automates on industrial ones — and the evidence base is stronger because the outputs are physical and auditable.
Amazon is the ceiling case. Its Shreveport, Louisiana fulfillment center, opened in late 2024 with roughly ten times the robotic density of earlier designs, is the company’s own benchmark for what full automation buys: Amazon states the facility’s innovations reduce fulfillment processing times and peak-season costs by up to 25%. Wall Street is treating that as directional rather than a one-off: Morgan Stanley’s analysis, based on Amazon CEO Andy Jassy’s public comments on the Shreveport results, projects the robotics rollout could unlock roughly $4 billion or more in annual savings as the model scales — an analyst estimate, not a company-reported figure, and worth treating with that caveat.
The demand-side counterpart is forecasting, the quietest high-ROI application in the stack. McKinsey’s research finds AI-driven demand forecasting cuts forecast error by 20–50% and can reduce lost sales from stockouts by up to 65%. Every stockout avoided, and every unit of safety stock liquidated, drops straight to margin — no customer-facing risk, no brand exposure. For most stores under roughly $20M in revenue, forecasting plus automated replenishment is the realistic warehouse-automation play, because it needs no physical infrastructure at all — just the order and inventory data your storefront already generates.
For the physical layer, the honest picture for anyone who isn’t Amazon:
- Adoption is still early. Amazon’s own robotics VP has framed the one-million-robot milestone as a leading indicator, not a norm most operators have reached — the vast majority of e-commerce warehouses run little to no robotics today.
- Paybacks vary by an order of magnitude by technology. Mobile, redeployable systems (autonomous mobile robots) tend to pay back fastest because the asset isn’t tied to one facility layout; fixed infrastructure like full robotic-picking builds takes years longer to clear.
- The constraint that decides everything upstream and downstream is inventory data quality. A demand forecast is only as good as the sell-through, returns, and lead-time data feeding it; a robotic pick is only as fast as the slotting logic directing it. McKinsey’s 20–50% error-reduction range exists precisely because the floor of that range belongs to companies with dirty data. Automation amplifies whatever data discipline you already have — no tool in this article outruns a miscounted bin.
Failure Modes, Honestly Stated
Every system above has a documented way to hurt you.
- Deflection masquerading as resolution. A chatbot that closes a ticket without solving the problem manufactures repeat contacts. Measure resolution-without-return, not deflection, or you’ll build a dashboard that looks like victory while CSAT quietly rots — the exact Klarna sequence.
- Action without authorization scope. An agent that can issue refunds can be social-engineered into issuing refunds. Constrain tool permissions per intent, cap refund values without human approval, and log every action.
- The 72-hour blind spot and per-resolution overages. Pricing that climbs precisely when volume spikes — a sale, a shipping delay, a recall — punishes you at your worst moment. Model the spike scenario, not the average month.
- Cold-start on long-tail SKUs. Demand models need history. New products, new markets, and one-off items get poor forecasts regardless of model quality; plan manual overrides for anything without 12+ months of data.
- Hallucinated policy. If a return policy lives only in a PDF buried in a web page, some agent stacks can’t read it reliably and will improvise. Knowledge needs to live in structured, retrievable form — a content-ops problem wearing an AI costume.
- Full-replacement framing itself. The single clearest lesson from Klarna, restated directly: treating AI as a headcount replacement rather than a triage layer is the failure mode, independent of how good the underlying model is.
The Sequence That Works
Deployment order matters more than tool selection.
1. Service AI on order-status/returns/cancellations (weeks, low capex). Highest repetition, lowest stakes, structured data. Success metric: resolution-without-return at 72 hours and 7 days — not deflection. Budget against a 26–56% year-one automation range on the repetitive pool (translate that into a total-support-spend percentage before you present it), and require a visible human path for anything emotional or high-value.
2. Demand forecasting and replenishment (one planning cycle). Feed it 2–3 years of order history plus promotion calendars. Success metric: forecast error and stockout rate by SKU class, before and after. This step also cleans the data that stages three and four depend on — treat it as infrastructure, not an outcome.
3. Warehouse execution automation (only above a real volume threshold). Mobile robotics starts to clear its payback when pick labor is a real line item and order volatility is hurting you. Below that threshold, better slotting logic and barcode discipline capture most of the value at near-zero cost. If you can’t state your orders-per-day at peak, you’re not ready to spec robots.
4. Pre-purchase and retention last (highest variance, softest ROI). AI shopping assistants and generative personalization are real, but measurement is weakest here, and the failure surface is your brand voice. Deploy after the post-purchase stack is boring and reliable.
The Repetition–Stakes Grid
A simpler way to decide what to automate first, independent of stage: plot each ticket type or task on two axes — how structured the underlying data is (can a system reliably retrieve the answer) and how costly a wrong or clumsy answer is (a refund miscalculation vs. a bereavement-related account closure). High-structure, low-stakes work — the WISMO/returns wedge — belongs in an AI agent’s hands immediately. Low-structure or high-stakes work — anything involving hardship, disputes, or ambiguity — stays with a human regardless of how capable the model is. This is a planning heuristic to sort your own ticket taxonomy, not a scored industry framework; the value is in forcing the two questions before you automate anything.
Notice what this sequence implies: the customer-facing glamour projects come last, and the unglamorous middle — forecasting, data hygiene, returns logic — comes first. That’s the opposite of how most AI roadmaps get funded, and it’s a large part of why so many underdeliver.
FAQ
Is 60% automation realistic for e-commerce customer service?
Not in year one, and not against your whole ticket queue. Vendor “up to 60%” claims describe well-tuned, high-repetition stores measured against their automatable ticket pool only. Published case studies and independent performance data put realistic first-year results closer to 26–56% of that pool — which typically works out to single-digit-to-low-teens percent of total support spend once non-repetitive tickets are counted.
Did Klarna’s AI customer service actually fail?
No — it worked as designed and is still handling roughly two-thirds of Klarna’s inquiries today. What failed was treating it as a full replacement for staff rather than a triage layer, and scaling it on cost metrics without an equally rigorous quality measure. Klarna’s correction was a hybrid model, not an AI rollback.
How long does warehouse robotics take to pay back?
It varies by roughly an order of magnitude depending on the technology. Mobile, redeployable systems tend to pay back fastest because they aren’t tied to a fixed facility layout; large fixed robotic-picking installations take years longer to clear their capital cost.
Where should a smaller e-commerce store start with AI automation?
With service AI on order status, returns, and cancellations — it’s the fastest to deploy and the lowest-stakes. Demand forecasting and replenishment are usually the best second step, since they require no physical infrastructure. Warehouse robotics only becomes worth specifying once pick labor and order volume justify the capital outlay.
Where This Converges
The two economies in the diagram are already merging. Service agents are gaining warehouse tool access — returns processing, replacement-fulfillment triggers — while warehouse software gains conversational interfaces, and the platforms in the middle are absorbing both into native stacks. That will compress standalone tool margins over time and shift the buying question from “which point tool” to “which platform’s native automation runs deep enough.”
Two tools do the practical work covered here: run the Twin-Ledger Test before scaling anything customer-facing, and sort your ticket taxonomy on the Repetition–Stakes Grid before deciding what to automate first. Do both, and the rest of this article’s numbers become a budgeting exercise rather than a bet.
Sources cited
- Amazon deploys its 1 millionth robot — CNBC
- Amazon’s next-generation fulfillment center, Shreveport — About Amazon (primary/company source)
- Amazon robotics savings estimate — Morgan Stanley via CNBC
- Klarna CEO on the AI reversal — Forbes
- Klarna rehiring / hybrid model details — Customer Experience Dive
- Gartner: half of AI-attributed service cuts to reverse by 2027 — Gartner press release (primary)
- Gartner self-service vs. assisted cost-per-contact benchmark — Gartner (primary)
- Gorgias AI Agent pricing — Gorgias (primary/vendor source)
- Gorgias double-billing mechanics — Macha
- Gorgias real-world automation rate (26–56%), aggregated from published case studies — myAskAI (competing vendor — read framing accordingly)
- Gorgias AI Agent response-accuracy performance data (59% vs. 71% category average) — G2 (independent review platform, non-vendor)
- Gorgias 72-hour billing waiver — Chatarmin
- McKinsey demand-forecasting error reduction — MHI Solutions Magazine, citing McKinsey